Recent Market Volatility
February 2018
After a period of relative calm in the markets, in recent days the increase in volatility in the stock market has resulted in renewed anxiety for many investors.
From February 1–5, the US market (as measured by the Russell 3000 Index) fell almost 6%, resulting in many investors wondering what the future holds and if they should make changes to their portfolios.[1] While it may be difficult to remain calm during a substantial market decline, it is important to remember that volatility is a normal part of investing. Additionally, for long-term investors, reacting emotionally to volatile markets may be more detrimental to portfolio performance than the drawdown itself.
INTRA-YEAR DECLINES
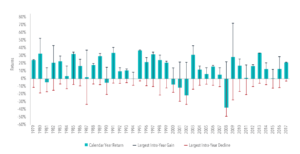
Exhibit 1 shows calendar year returns for the US stock market since 1979, as well as the largest intra-year declines that occurred during a given year. During this period, the average intra-year decline was about 14%. About half of the years observed had declines of more than 10%, and around a third had declines of more than 15%. Despite substantial intra-year drops, calendar year returns were positive in 32 years out of the 37 examined. This goes to show just how common market declines are and how difficult it is to say whether a large intra-year decline will result in negative returns over the entire year.
Exhibit 1. US Market Intra-Year Gains and Declines vs. Calendar Year Returns, 1979–2017

In US dollars. US Market is measured by the Russell 3000 Index. Largest Intra-Year Gain refers to the largest market increase from trough to peak during the year. Largest Intra-Year Decline refers to the largest market decrease from peak to trough during the year. Frank Russell Company is the source and owner of the trademarks, service marks, and copyrights related to the Russell Indexes.
REACTING IMPACTS PERFORMANCE
If one was to try and time the market in order to avoid the potential losses associated with periods of increased volatility, would this help or hinder long-term performance? If current market prices aggregate the information and expectations of market participants, stock mispricing cannot be systematically exploited through market timing. In other words, it is unlikely that investors can successfully time the market, and if they do manage it, it may be a result of luck rather than skill. Further complicating the prospect of market timing being additive to portfolio performance is the fact that a substantial proportion of the total return of stocks over long periods comes from just a handful of days. Since investors are unlikely to be able to identify in advance which days will have strong returns and which will not, the prudent course is likely to remain invested during periods of volatility rather than jump in and out of stocks. Otherwise, an investor runs the risk of being on the sidelines on days when returns happen to be strongly positive.
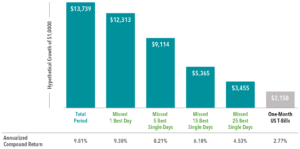
Exhibit 2 helps illustrate this point. It shows the annualized compound return of the S&P 500 Index going back to 1990 and illustrates the impact of missing out on just a few days of strong returns. The bars represent the hypothetical growth of $1,000 over the period and show what happened if you missed the best single day during the period and what happened if you missed a handful of the best single days. The data shows that being on the sidelines for only a few of the best single days in the market would have resulted in substantially lower returns than the total period had to offer.
Exhibit 2. Performance of the S&P 500 Index, 1990-2017

In US dollars. For illustrative purposes. The missed best day(s) examples assume that the hypothetical portfolio fully divested its holdings at the end of the day before the missed best day(s), held cash for the missed best day(s), and reinvested the entire portfolio in the S&P 500 at the end of the missed best day(s). Annualized returns for the missed best day(s) were calculated by substituting actual returns for the missed best day(s) with zero. S&P data © 2018 S&P Dow Jones Indices LLC, a division of S&P Global. All rights reserved. One-Month US T- Bills is the IA SBBI US 30 Day TBill TR USD, provided by Ibbotson Associates via Morningstar Direct. Data is calculated off rounded daily index values.
CONCLUSION
While market volatility can be nerve-racking for investors, reacting emotionally and changing long-term investment strategies in response to short-term declines could prove more harmful than helpful. By adhering to a well-thought-out investment plan, ideally agreed upon in advance of periods of volatility, investors may be better able to remain calm during periods of short-term uncertainty.
Source: Dimensional Fund Advisors LP.
Indices are not available for direct investment. Their performance does not reflect the expenses associated with the management of an actual portfolio. Past performance is not a guarantee of future results. Diversification does not eliminate the risk of market loss.
There is no guarantee investment strategies will be successful. Investing involves risks including possible loss of principal. Investors should talk to their financial advisor prior to making any investment decision. There is always the risk that an investor may lose money. A long-term investment approach cannot guarantee a profit.
All expressions of opinion are subject to change. This article is distributed for informational purposes, and it is not to be construed as an offer, solicitation, recommendation, or endorsement of any particular security, products, or services. Investors should talk to their financial advisor prior to making any investment decision.
[1]. Frank Russell Company is the source and owner of the trademarks, service marks, and copyrights related to the Russell Indexes.